Tues Oct. 1, 2013
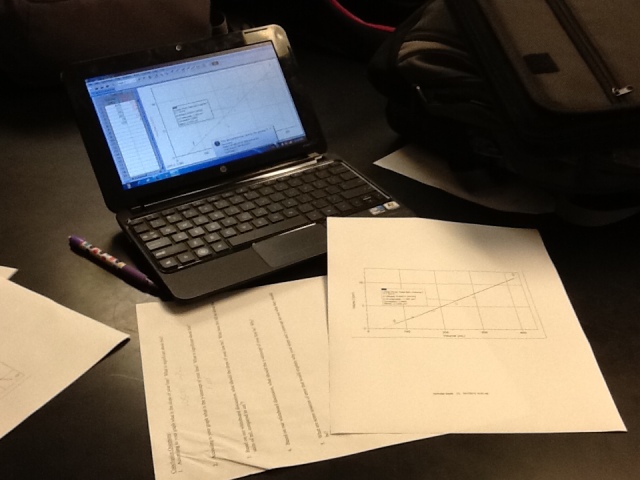
 Chemistry 1 – Groups took there data from measuring volume in cm^3 and volume in mL and entered that data into LoggerPro. For most of these chemistry students this is their first of many times experiencing the power of LoggerPro! We finished the class by having groups analyze their slopes and y-intercepts. They were asked to agree on what was significant about these numbers. We will look at group data tomorrow.
Physics 1 – Groups continued to work with a pre-programmed robot,that was set to move in four distinct segments of motion (faster, slower, stopped, forward and/or backward). They worked on programming another robot to move EXACTLY as the first one. This required measurements and an understanding of position change and time change. Some used guess and check, but the discussions they had about we need that one to take longer, or move farther or forward/backward made that method fine to use, and still relevant to physics.
Chemistry 2 – We worked on Molar Concentration and Stoichiometry lab. Students were given a known concentration of NaOH and were asked to use that to find the concentration of regular vinegar. By using precise volume measurements (buret) and an indicator solution groups will be able to determine when the reaction is “perfect.” (Note for other teachers, yes I know this is technically a titration, but we haven’t done acid/base chemistry yet.)